Project Overview
This project delivers a comprehensive Business Intelligence (BI) analysis of the Formula 1 World Championship from 1950 to 2024 using Microsoft Power BI. The goal was to transform complex historical motorsport data into clear, interactive, and decision-focused dashboards.
Formula 1 generates vast volumes of data across races, drivers, constructors, circuits, and seasons. This BI system makes exploration intuitive and insight-driven for analysts, stakeholders, and fans.
Project Goal
To build an interactive BI system that enables users to explore historical performance, operational trends, and the global expansion of Formula 1 through intuitive dashboards and KPIs.
Project Results & Visual Output
Below are some examples of the interactive dashboards and visual outputs generated by the Power BI solution. These dashboards allow drill-down, filtering, and comparative analysis across drivers, teams, seasons, and circuits.
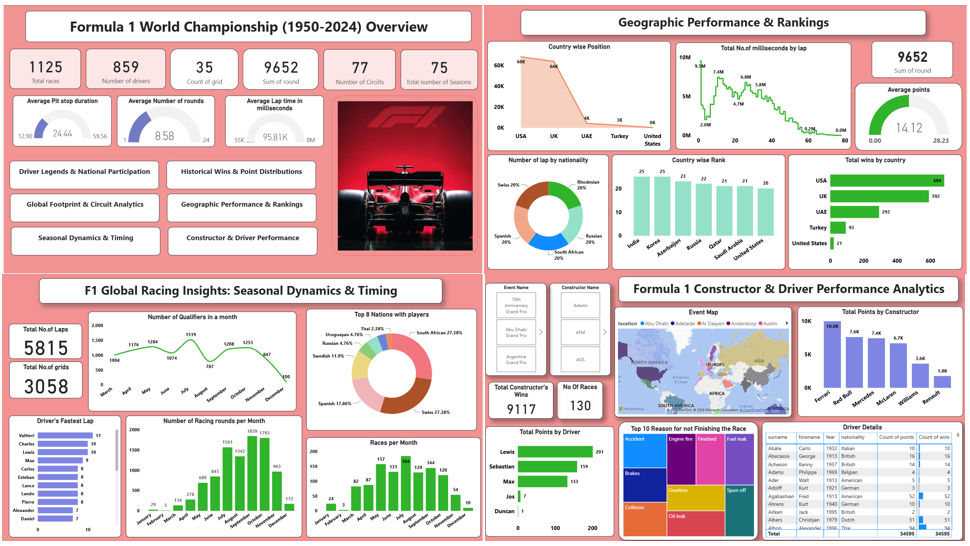
Formula 1 World Championship Data Dashboard (spanning 1950–2024).
Key Features & Achievements
- Integrated multi-table F1 datasets: races, drivers, constructors, circuits, lap times, pit stops, and standings
- Designed a robust star-schema data model linking fact and dimension tables
- Performed extensive data cleansing using Power Query (M)
- Created dynamic DAX measures for KPIs: races, wins, points, laps, averages, rankings
- Developed interactive dashboards: championship overview, performance, geography, trends
- Enabled drill-down, filtering, and comparative analysis across eras and entities
Technologies Used
Business Intelligence
- Microsoft Power BI
- Interactive Dashboards
Data Modelling
- Star Schema
- Fact–Dimension Relationships
Data Transformation
- Power Query (M Language)
- Data Cleansing
Analytics & Visualisation
- DAX (KPIs, Rankings, Aggregations)
- KPI Cards, Maps, Slicers, Trend Charts
Use Cases
- Sports performance and trend analysis
- Executive dashboards for motorsport stakeholders
- Fan engagement and historical exploration platforms
- Data-driven storytelling and reporting
- BI solutions for large, complex datasets
What This Project Demonstrates
This project demonstrates the ability to build production-quality Business Intelligence solutions that handle large historical datasets, deliver actionable insights, and showcase advanced data modelling, DAX, and professional dashboard design.